Build custom analytics dashboards in BI tools
The Data API enables the creation of custom dashboards in your BI tools. Base tables such as conversations, interactions, plugin calls, plugin resources, and users allow you to build dashboards, which are presented by Moveworks under Copilot Insights with more granular access controls, or to build your own custom dashboards.
This guide focuses on creating metrics using the Data API and teaches you how to use SQL queries to build metrics on top of the data ingested through the Data API.
Building knowledge insights through Data API
We want to build out a dashboard which allows us to understand how knowledge base plugin is being used in AI Assistant and achieve the following goals
- Provide insights to our COE team on what is being served through AI Assistant.
- Learn user feedback on the served content.
- Understand gaps and areas where new content needs to be created.
- Knowledge content performance
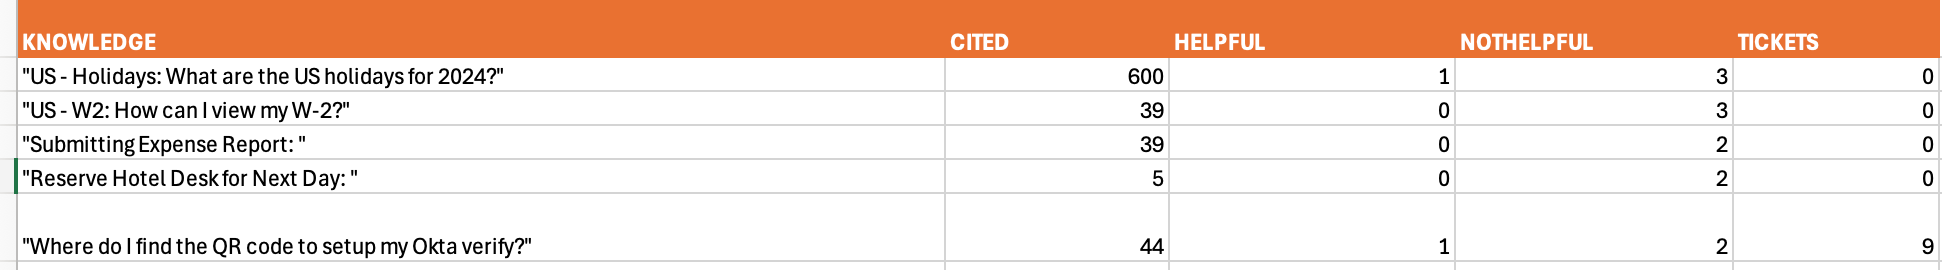
Let’s consider the use case where we need to share the performance of knowledge content with the Center of Excellence team. The inputs the team requires are:
- Knowledge content name
- Number of times it was cited
- Number of times it was rated unhelpful
- Number of times a ticket was filed when this content was cited
To obtain these details, we need to examine the plugin resources and the interaction table. Assuming all data is ingested into your database, we need to fetch the knowledge content name and the count of conversations where this knowledge was cited from the plugin resources table. Additionally, we must access the interactions table to identify conversations where the cited resource was rated as helpful/unhelpful or where a ticket was filed by the end user.
The above query provides us with a table view which lists down all the knowledge content name and metrics related to its performance. This can be shared with the COE to understand the performance of the cited items. You can recreate the same view in your powerBI by ingesting the data provided by this query in your environment.
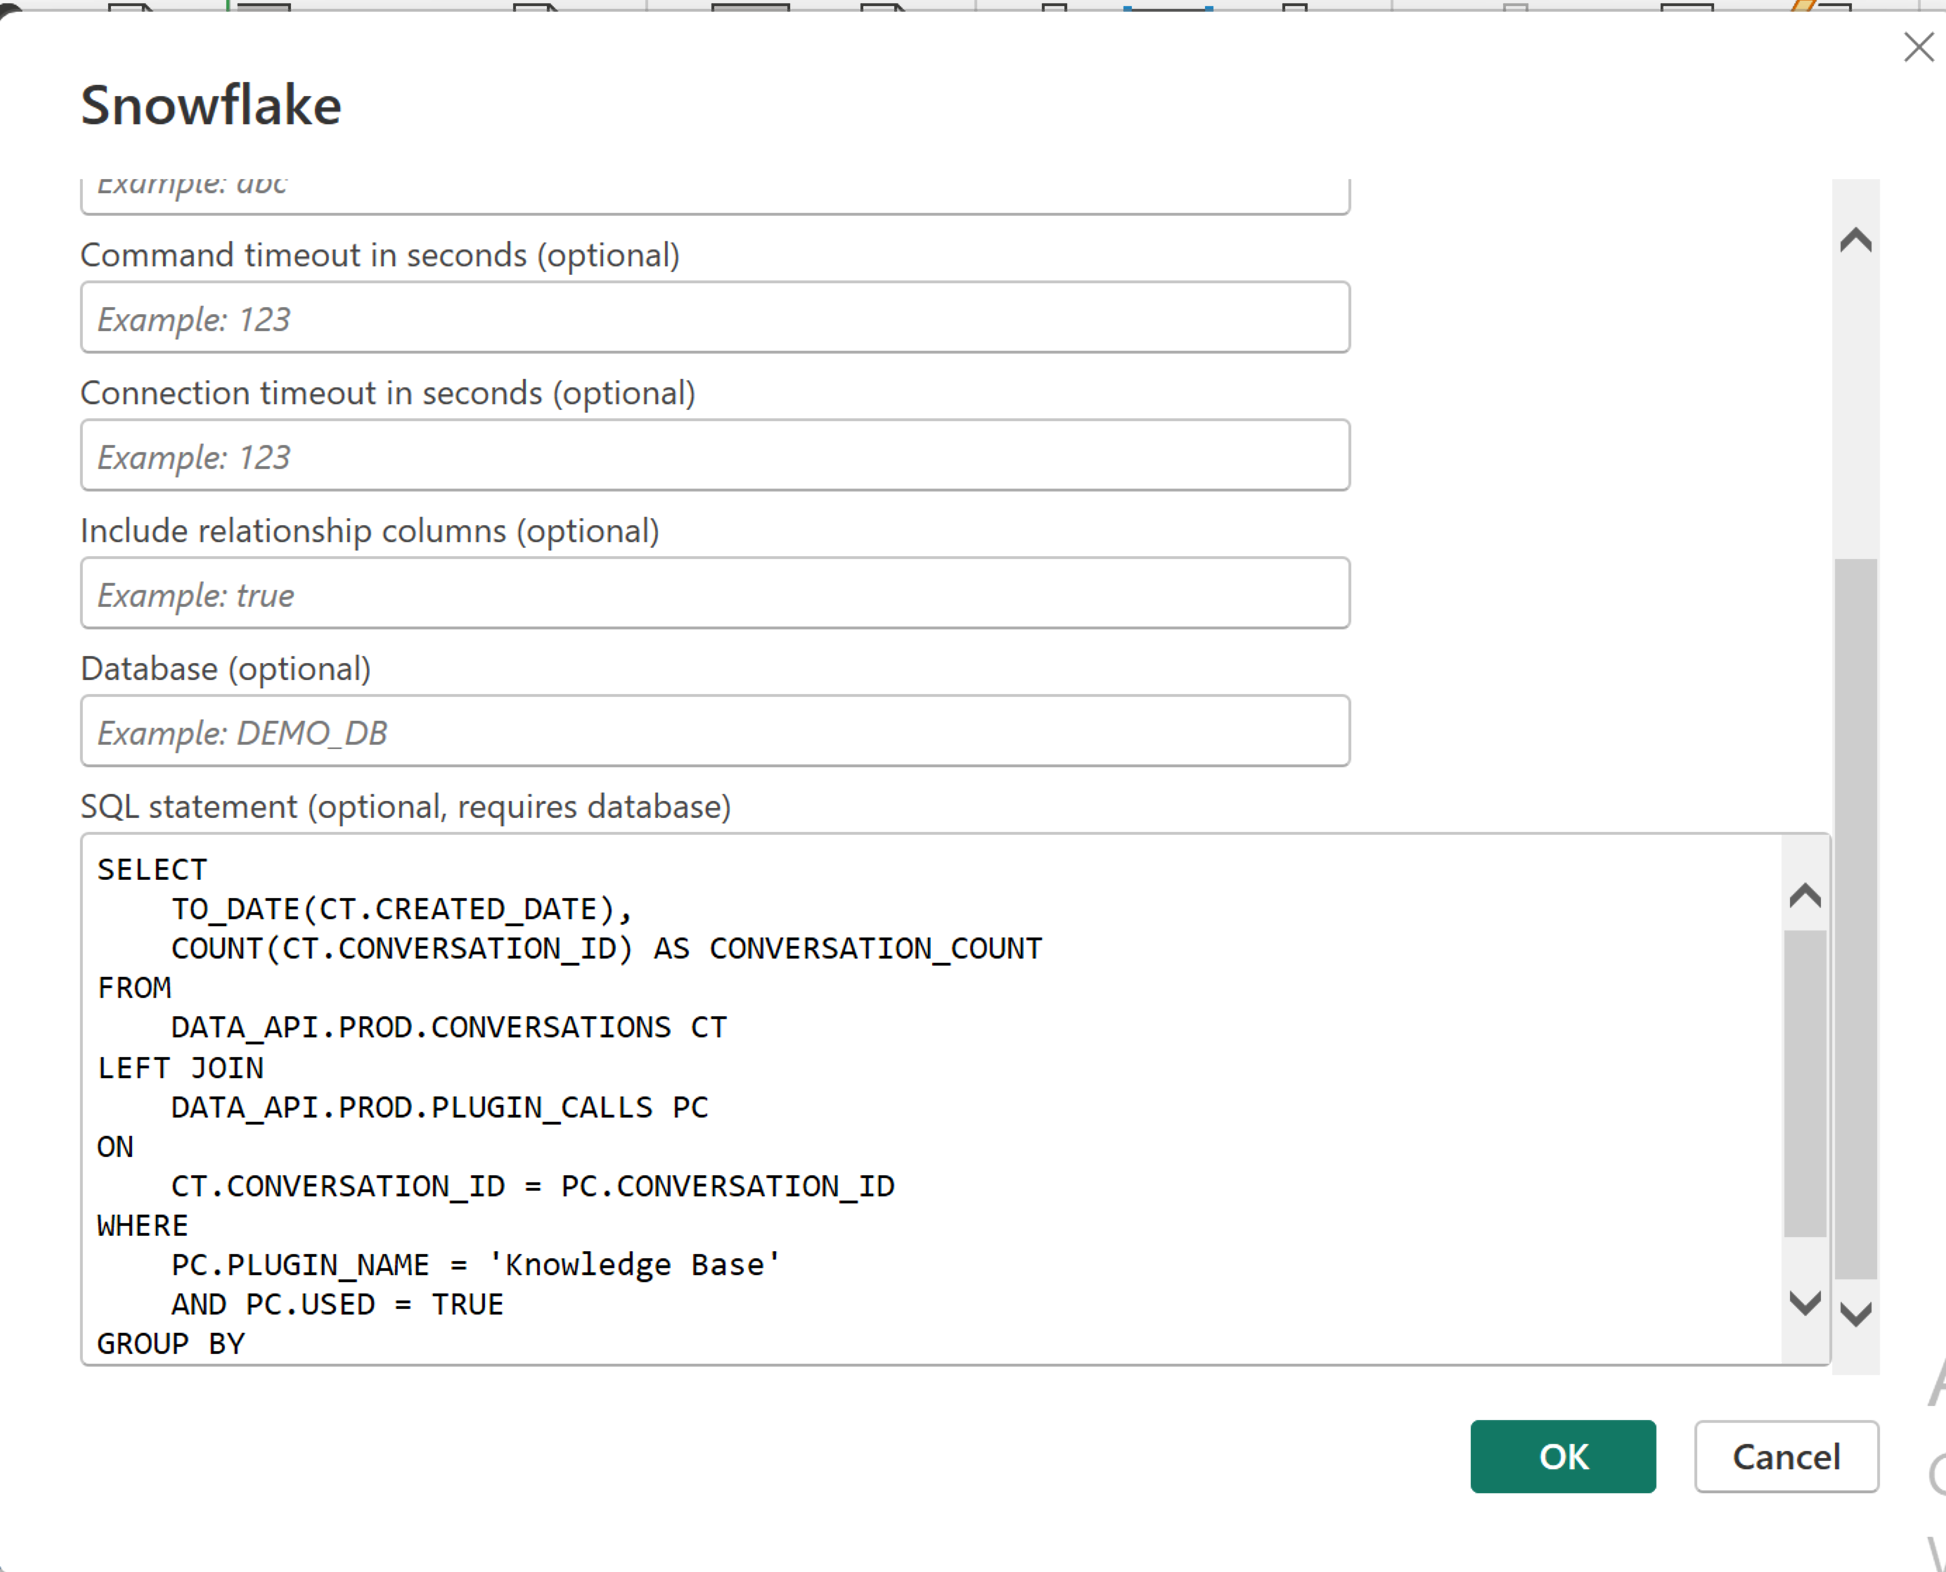
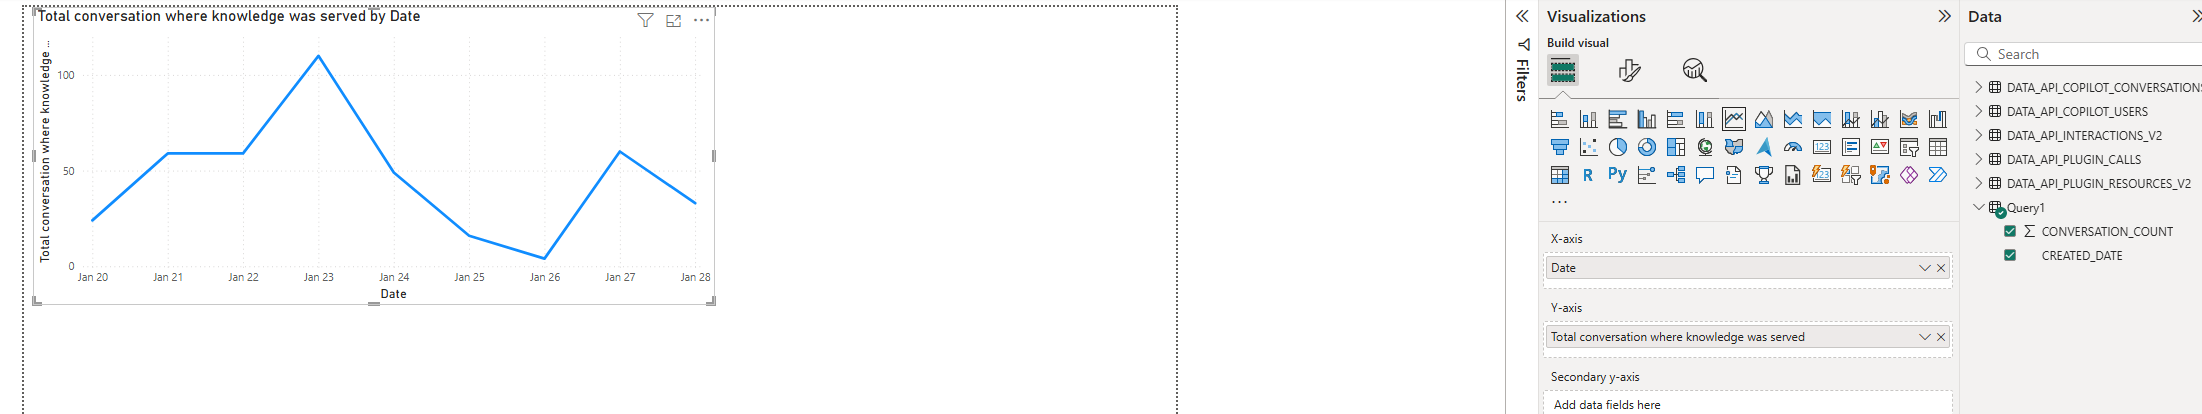
- Total number of conversations where Knowledge base plugin was served successfully.
Let’s understand the query that is required for us to build this metric. We need to find the total number of conversations where knowledge plugin was Used and distribute this data based on date.
These are the following columns that we need to use
- Conversation ID
- Plugin name
- Used
- Created time for conversation
The following SQL query creates a table view which can be used in PowerBI to create a trend chart.
- Please edit the SQL queries according to the table and field name you have created in your data lake.
The result of this query should look like below
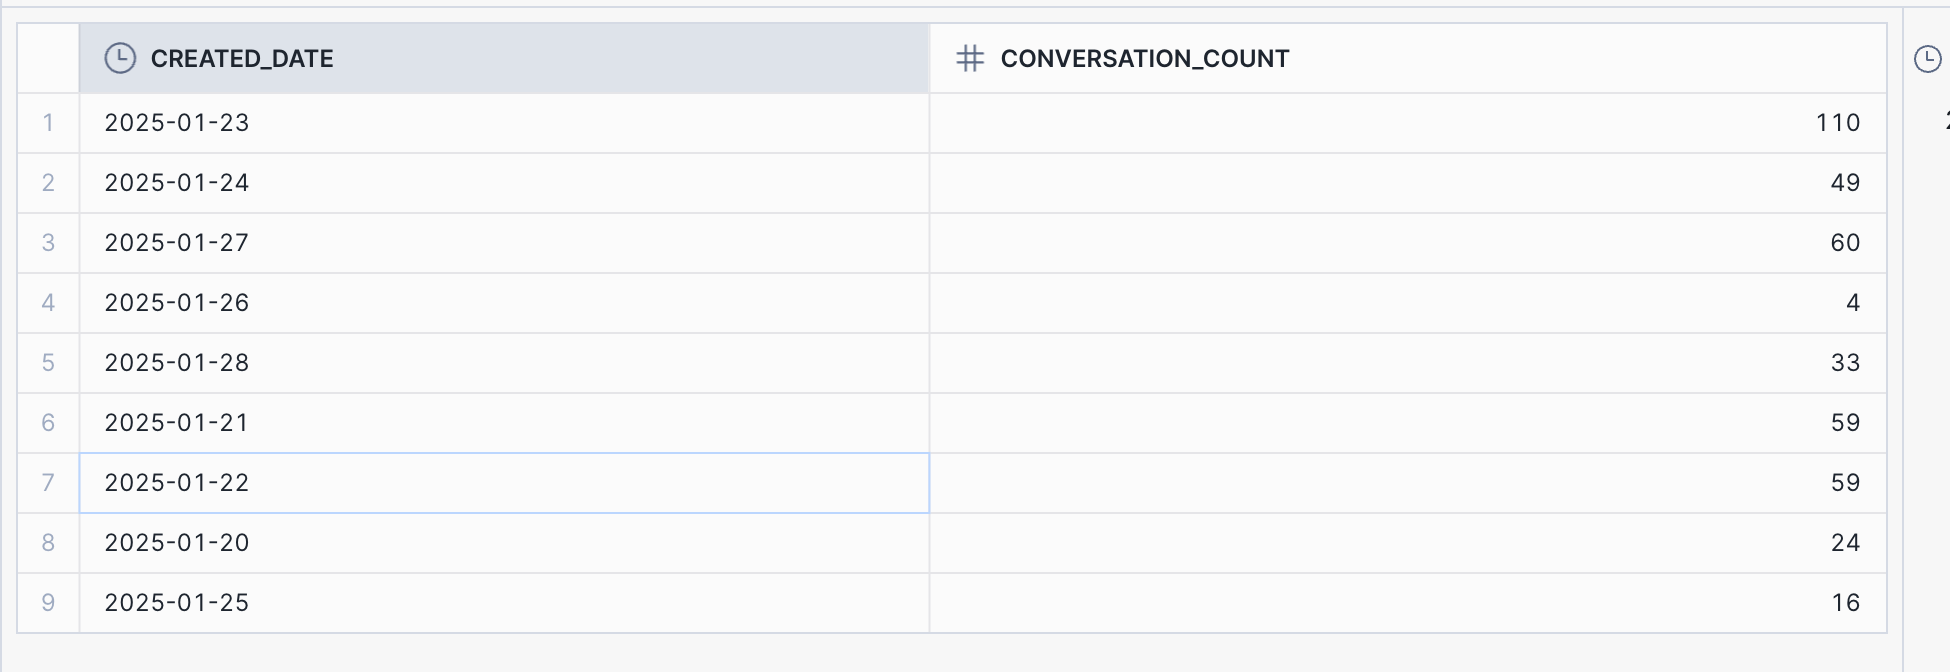
You can define this SQL query while connecting PowerBI with Snowflake
Let’s select a trend chart and plot the date on x-axis and count of conversations on the y-axis. This will provide us a trend chart to view to see conversations where knowledge was server per date.
- Knowledge Gaps
When a knowledge base plugin is considered but not served during a conversation, it is identified as a knowledge gap. This is specifically a prescriptive knowledge gap, although there may be instances where another plugin could provide the correct answer to the user’s request.
The raw data via the Data API enables us to construct both a prescriptive knowledge gap, as displayed on the knowledge insights dashboard, and modify our query to include custom logic. In this scenario, we will consider a knowledge gap only when the smart handoff plugin is served, and the knowledge plugin is considered but not served.
We can achieve this by using the plugin calls table. The “served” attribute provides a clear indication of whether a plugin was served to the end user or not. In a scenario where knowledge was considered but not served, there will be an entry in the plugin calls table with the plugin name as “knowledge base” and “served” marked as false.
We can also define the additional filter like considering only the scenarios where smart handoff plugin was served.
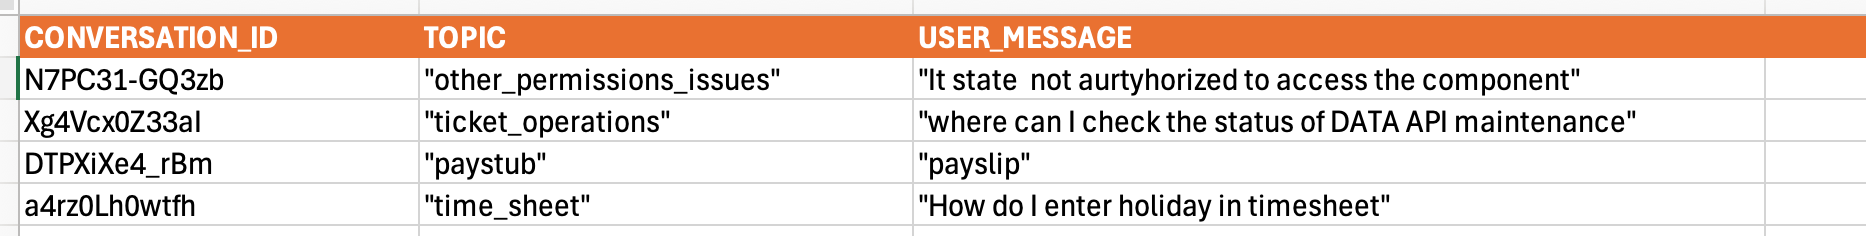
We can also fetch additional details such as the user message and the topic in order to understand the knowledge gaps in more detail
We have joined the plugin calls table with the interaction table to get more details on where topic , conversation ID and the user message where the knowledge plugin failed to trigger.
This gives the following view, we can use this to create a table in PowerBI or tableau
- User feedback when knowledge base plugin was served
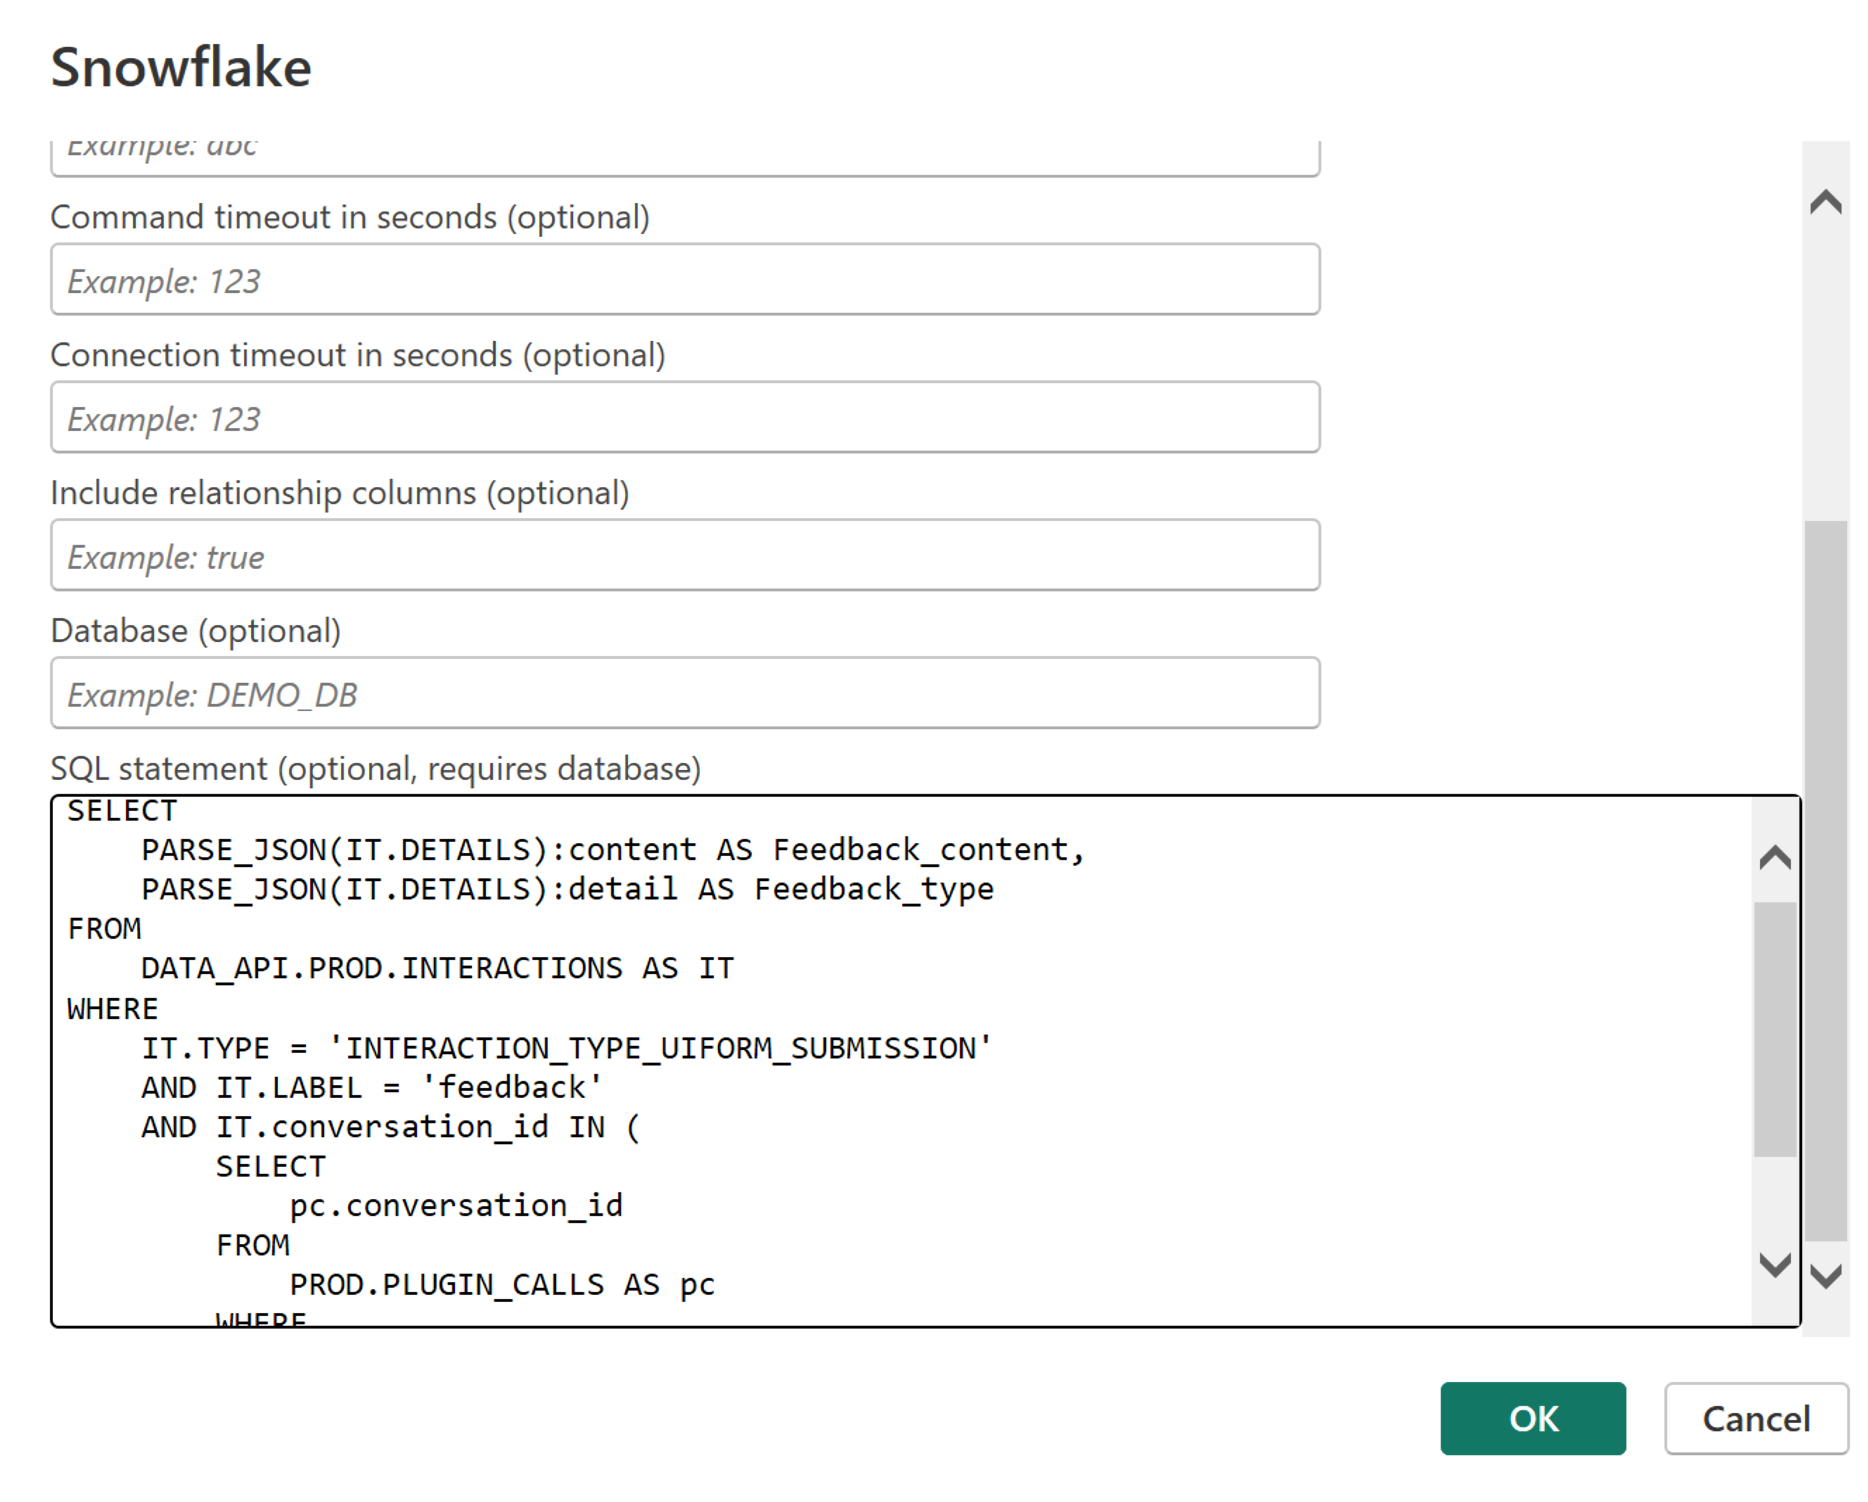
User feedback is captured as an UI form interaction whenever an end user has submitted the feedback. To understand what user feedback was provided when a knowledge plugin is served we need to find conversations with feedback UI form submission and knowledge plugin call.
Query to fetch feedback type and free-text verbiage.
This query can be passed in the snowflake connector for powerBI and a table visualization can be made using this data.